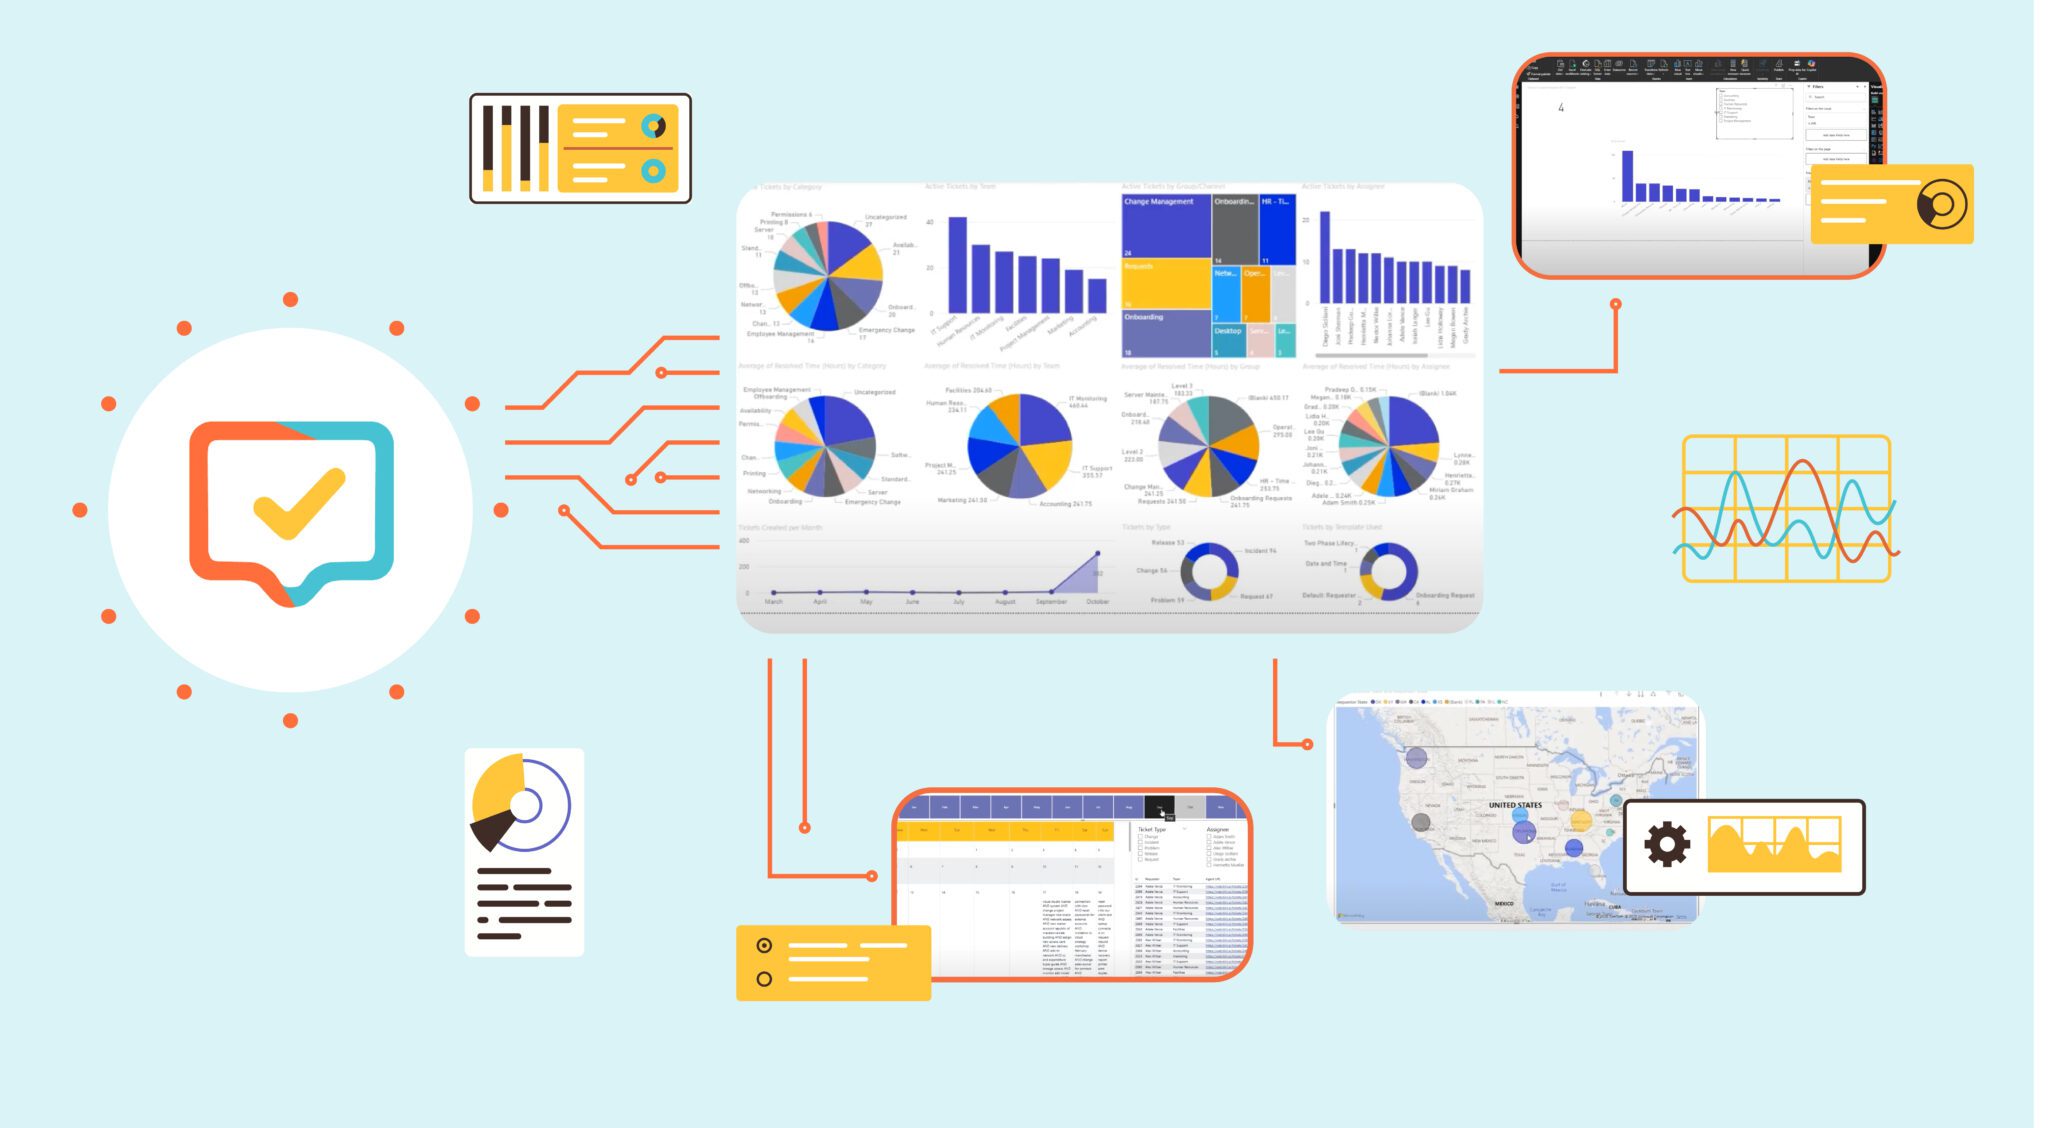
Dashboards are more than just colorful charts—they’re powerful tools for driving smarter decisions and improving IT support. But creating dashboards that are both visually appealing and actionable can be tricky. In a recent webinar, Cireson’s Adam Dzyacky and Geoff Ross shared practical strategies for building dashboards in Tikit that provide meaningful insights and help teams work more efficiently. Here are their top 10 tips for creating dashboards in Tikit that actually get results.
1. Start With Clear Questions
Before designing a dashboard, ask: “What decision does this visual help make?” Focus on the metrics that matter, and avoid cluttering your dashboard with data that doesn’t inform action.
2. Keep It Simple
Overloading dashboards with too many filters, visuals, or fields can confuse users. Start with core KPIs and iterate as needs evolve. A clean, simple dashboard is always easier to understand.
3. Leverage Filters and Slicers
Use filters and slicers to make your dashboard interactive. Users can dynamically adjust views by department, location, ticket priority, or date range—without needing separate reports for each scenario.
4. Combine Data Sources
Merge Tikit data with external sources like HR CSV exports to enrich insights. For example, linking ticket activity with employee start dates helps identify new hires who might need additional onboarding support.
5. Use Relative Filters
Use relative filters (like “last 30 days”) instead of hardcoding specific dates. This keeps your dashboard automatically up-to-date and relevant without constant manual adjustments.
6. Visualize Meaningfully
Charts are great for spotting trends, but tables are still valuable for details. Tables can show ticket IDs, requesters, subjects, and even direct links to the Tikit agent portal, all while respecting applied filters.
7. Highlight Actionable Insights
Dashboards should drive improvement. Identify top requesters, recurring IT issues, or training gaps to help teams take action rather than just observe data.
8. Automate Reporting
Publish dashboards to Power BI Online or Microsoft Teams for always-accessible, live data. Use Power Automate to schedule automatic dashboard refreshes or email alerts to stakeholders.
9. Work With Templates and Custom Forms
Power BI supports data from Tikit templates and custom fields. Duplicate queries for specific templates to create clean, focused datasets that match your reporting goals.
10. Align With Your Business Goals
Every visual should connect to a business outcome—whether improving IT support, onboarding, or operational efficiency. A dashboard that answers critical business questions is more valuable than one that just displays numbers.
Conclusion:
An effective dashboard isn’t just a collection of charts, it’s a decision-making tool. By applying these 10 tips, you can design Tikit dashboards that are clear, interactive, and actionable. Teams can spot trends, respond proactively, and ultimately work smarter, not harder.
Pro Tip:
Start simple, then build iteratively. Your dashboard will grow with your organization’s needs—and deliver insights that truly matter.