Introduction: The dashboard challenge
I love leveraging dashboards to track and monitor activities and measures. The Cireson Portal dashboard provides flexibility in layout, content, and datasources to show information in real-time within the Portal application.
On my dashboard I have been working with two charts; Tickets Closed and Tickets Created. These charts share the same axis type but I’d really like to combine the charts in order to reduce space on the dashboard page:

Same axes, double the space!
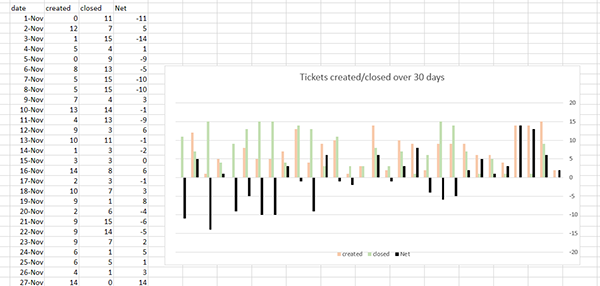
I started by mapping out an example of the data visualization I was looking for by using an Excel chart. This gave me a clearer idea of the outcome before spending time and resources on a solution. I also added a column that provided a net value of tickets created/closed.

Example of data visualization planned
With the outcome in mind, it was time to put this into action. Thanks to some clever work from our support analysts*, we were able to create a custom chart that met the challenge. Here’s how we did it…
The steps:
1. Create the right datasource
SQL Magic: The chart we are creating needs to have the data provided in a single query. My previous 2 charts had a datasource for each, so we needed to write the query to combine them. Thanks to John Doyle, we came up with a query that links the count of tickets created and completed by date to a rolling 30-day date value. A difference in those values provides the net value.
 Code to create the datasource. We can get you a copy!
Be sure to test that your code returns the data you are expecting. In this case, we get 31 rows (current day plus previous 30) by 8 columns of data.

Now that the query is created, we need to add it to our datasources table so we can reference it. There are a number of ways to create a data source. From the dashboard query settings page in the portal, we added our query and gave it a name so we could find it for referencing later.

Admin Settings > Dashboard Query Settings
2. Modify the Kendo Chart
Leverage the Kendo UI: Our out-of-the-box charts use Kendo UI and with some basic knowledge, and lots of examples (see https://demos.telerik.com/kendo-ui/bar-charts/column), we were able to modify a multi-column stacked chart to represent our data the way we wanted. Here’s an example from the kendo demo page:

Kendo UI Dojo – great place to work out!
What we needed to add to the script for our purposes was the API call to access our datasource. We also edited the series to show the items the way we wanted. The snippet below shows the URL used to call the datasource and one example of the series used.

Snippet of code from Kendo Chart
The queryId in the URL is the guide for the datasource we created. Running a quick query from SQL will show the value in the id field.

Now that we have all the elements tying our custom Kendo chart to data from the Portal, we can go to the third and final step.
3.Bringing the chart to the Portal
The beauty of CustomSpace: Our code for the chart will reside in the CustomSpace folder on the Portal server, loaded by custom.js, and presented to the dashboard in a html/text widget.
We created a folder to contain the chart code which has been wrapped in a function that we can call in a web page. Using a scriptloader (best practice for managing code) in the custom.js file we run our function only when on a dashboard page.

Snippet of the multiStack.js file and folder location
The custom chart is loaded with one line of code in a text/html widget and will resize with the content layout.

HTML/text widget with a <div> to call the function
Once the dashboard page is saved and refreshed, the custom chart is loaded to the page. The resulting chart is multi-column and stacked, providing information on created and completed tickets by day as well as the ticket type in each stack. The net column provides a quick visual cue of the net count of tickets created/closed each day.

Our new, cool-looking custom chart!
This reduced the dashboard space by half while providing more information. The legends are selectable, so comparisons and trends can be highlighted quickly within the chart.
In Conclusion.
This has been quite an involved look into the world of custom dashboard charts. This real-world example will be available on our community site as a guide. While we already have useful out-of-the-box dashboard tools, our hope is that this example has broadened your horizons to what is possible.
We would love to hear about your ideas and implementations of cool dashboard visualizations. Please check us out on the community for the scripts used in this example.
*Special thanks to John Doyle and Justin Workman for crafting this elegant solution!
Happy Dashboarding!


